Blog
Congress Stock Trading Performance: Who Beats the S&P 500?
Politician Stock Tracker
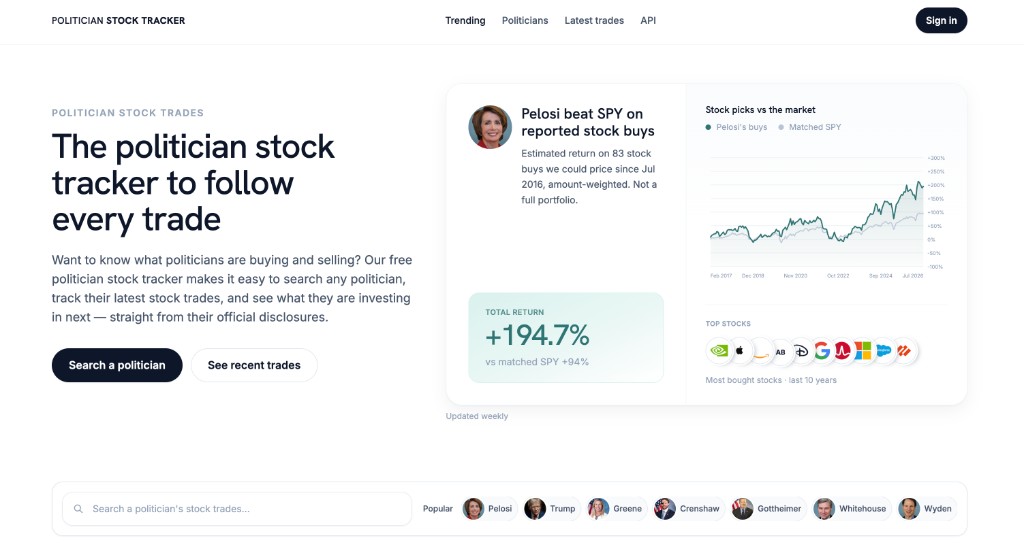
Congress stock trading performance is one of the most searched questions in this space: lawmakers file thousands of stock trades, but how do those purchases actually perform versus a fair market benchmark?
Who beats the S&P 500?
We score disclosed stock purchases over the last 10 years against matched S&P 500 buys on the same dates and estimated trade sizes—not a single buy-and-hold SPY line.
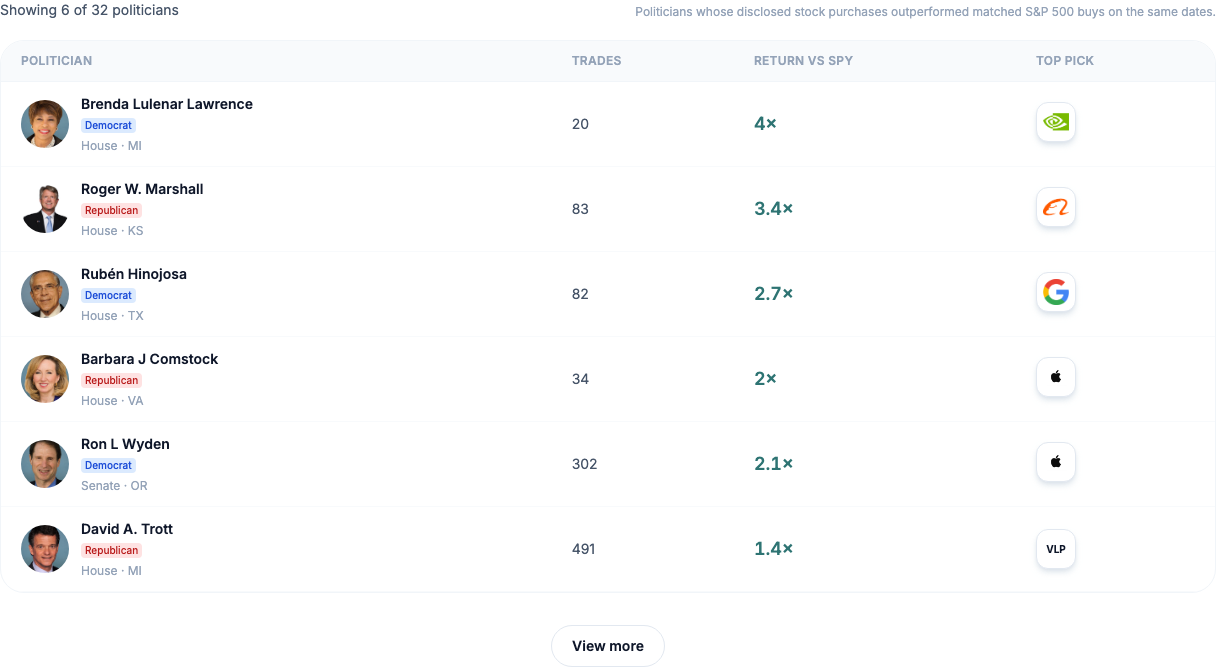
32 members currently clear that bar on our politicians beating the market list (beatSpyMultiplier above 1.0). That is a subset of everyone in Congress; members need enough priced buys in the window to rank at all.
Performance leaders
Members with the widest gap vs matched benchmark purchases in our data:
| Member | Disclosed return (10y) | vs matched SPY |
|---|---|---|
| Brenda Lawrence | +1,194% | 4.0× |
| Roger Marshall | +977% | 3.4× |
| Rubén Hinojosa | +946% | 2.7× |
| Barbara Comstock | +540% | 2.0× |
| Ron Wyden | +468% | 2.1× |
Returns are amount-weighted estimates from disclosure ranges, not audited portfolio statements.
What hurts comparability
- Late filings can mean the public learns about trades weeks or months later.
- Ranges ($1,001–$15,000, etc.) force midpoint estimates.
- Sales and non-stock assets are outside this purchase-return model.
For a full leaderboard—including members who lagged the matched benchmark—see best performing politicians.
Track this on Politician Stock Tracker
Compare performance, timing, and holdings on Politician Stock Tracker. Filter to outperformers on politicians beating the market or open any member’s stock tracker page for trade-level detail.
Disclaimer
Built from public STOCK Act filings. Educational use only—not investment advice.