Blog
David Rouzer Insider Trading Claims: What His Stock Trades Show
Politician Stock Tracker
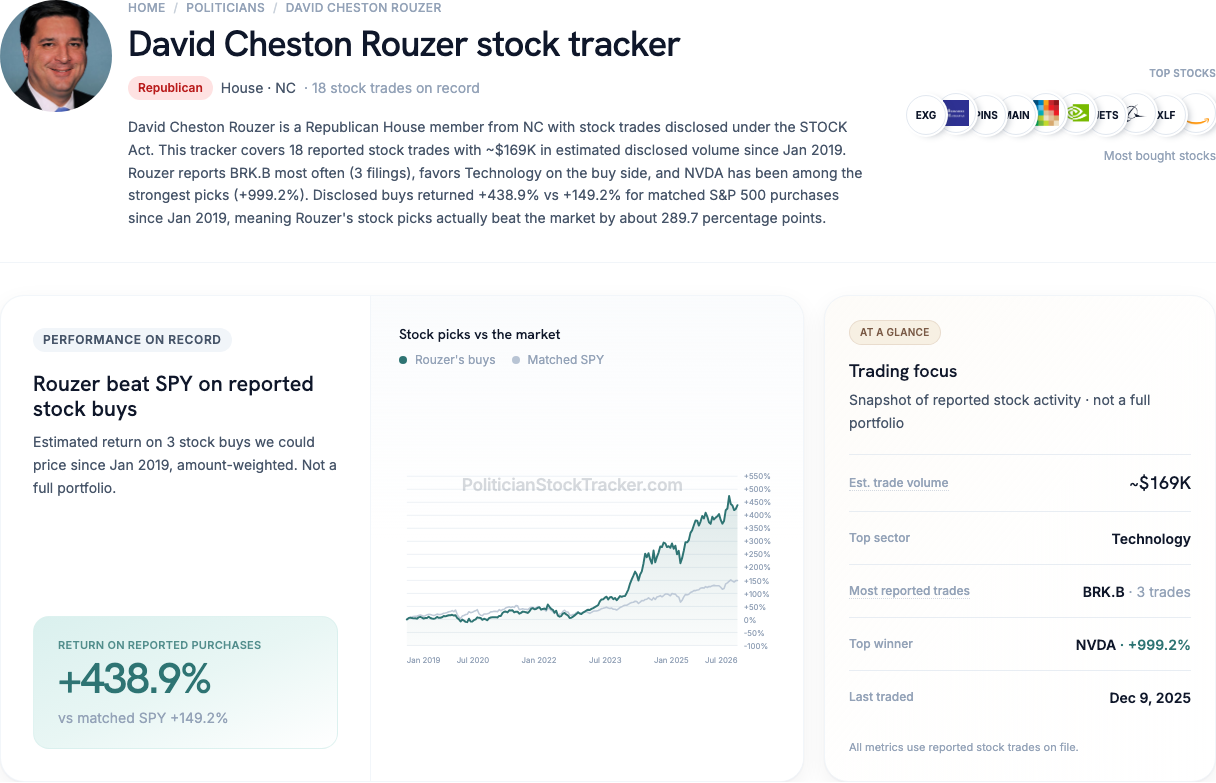
David Rouzer insider trading is not a common search—but his disclosure record shows one of the largest S&P 500–beating return gaps in Congress on paper. We do not claim he broke the law. The nuance: those returns rest on very few priced purchases, while his timing scores sit below random luck.
The short answer
| Question | What our data shows |
|---|---|
| Did his reported buys beat the market? | On paper, yes—a lot. About 439% vs about 149% for the S&P 500 (2.9×)—but on only 3 purchases |
| Did he pick unusually good days to trade? | No. About 43% overall (50% is pure luck) |
Headline returns and timing tell opposite stories—and the return figure is not a broad portfolio track record.
Did his buys beat the market?
Here's how we measure it. We take the stock purchases Rouzer disclosed, estimate how those buys did, and compare that to buying the S&P 500 (via SPY, a fund that tracks the index) with the same money on the same days.
Our data shows about 439% estimated return on disclosed stock purchases we could price since January 2019—versus about 149% for the S&P 500 on the same dates (2.9×).
The critical caveat: that track record reflects only 3 stock buys we could price. Names in his filing history include EXG, BRK.B, PINS, MAIN, and MO—not a mega-cap tech basket.
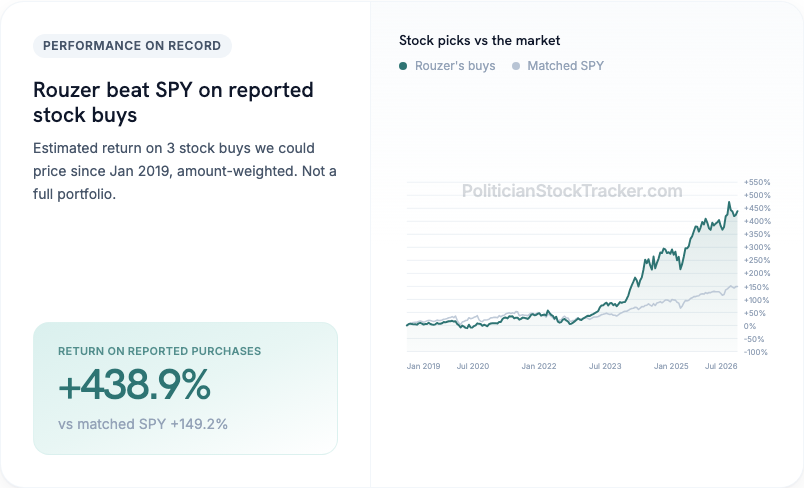
A 439% line on three disclosed purchases is not the same as “Rouzer beat the market for a decade.” Treat it as what those specific buys did, not proof of broad investable skill.
Did he time the market?
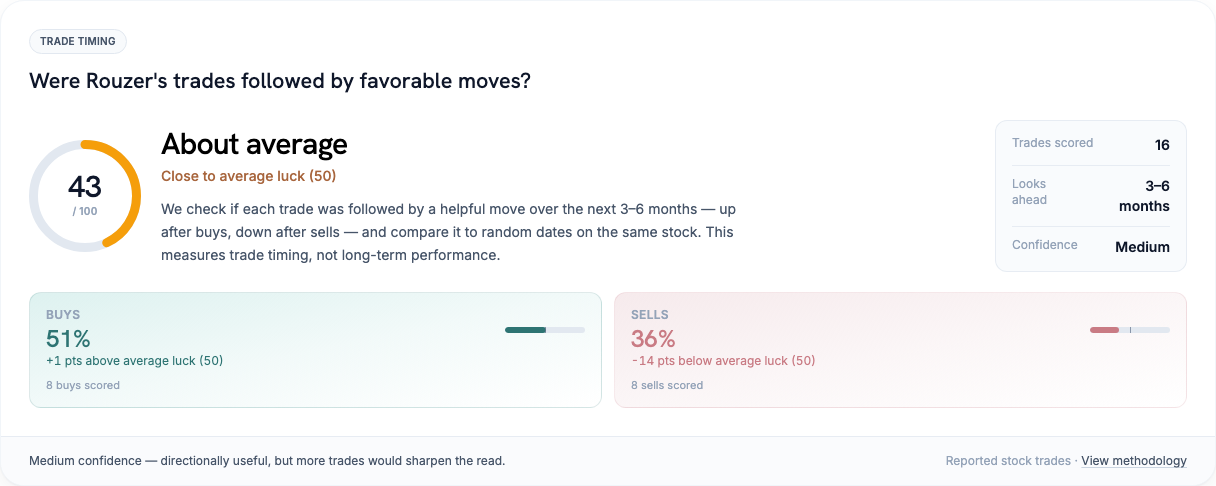
"Timing" asks: when Rouzer bought or sold a stock, was that a better day than a random day for that same stock?
Think of 50% as a coin flip.
| Measure | Score | vs 50% luck |
|---|---|---|
| Overall | 43% | −7 points |
| Buys | 51% | +1 point |
| Sells | 36% | −14 points |
- We scored 16 trades across 10 stocks (medium confidence).
43% overall is below random luck—especially with sell timing at 36%. That undercuts any story that Rouzer systematically picked perfect days to trade, even while those few buys look spectacular on a return chart.
Putting both together
- Market returns on buys: a handful of purchases with huge estimated gains vs the S&P 500.
- Trade timing: no calendar edge—if anything, worse than chance overall.
This is the returns-vs-timing split in extreme form: a chart that screams “genius investor,” timing numbers that say “not especially good at picking days.” Neither proves insider trading; both show why readers must separate which stocks from when they traded.
Track this on Politician Stock Tracker
See Rouzer's live numbers on Politician Stock Tracker at his David Rouzer stock tracker page.
Disclaimer
Data compiled from public STOCK Act financial disclosure filings. Return and timing figures use disclosed purchase ranges and statistical models; small sample sizes can distort headline percentages. This article does not allege insider trading. Not legal or investment advice.