Blog
Dean Phillips Insider Trading Claims: What His Stock Trades Show
Politician Stock Tracker
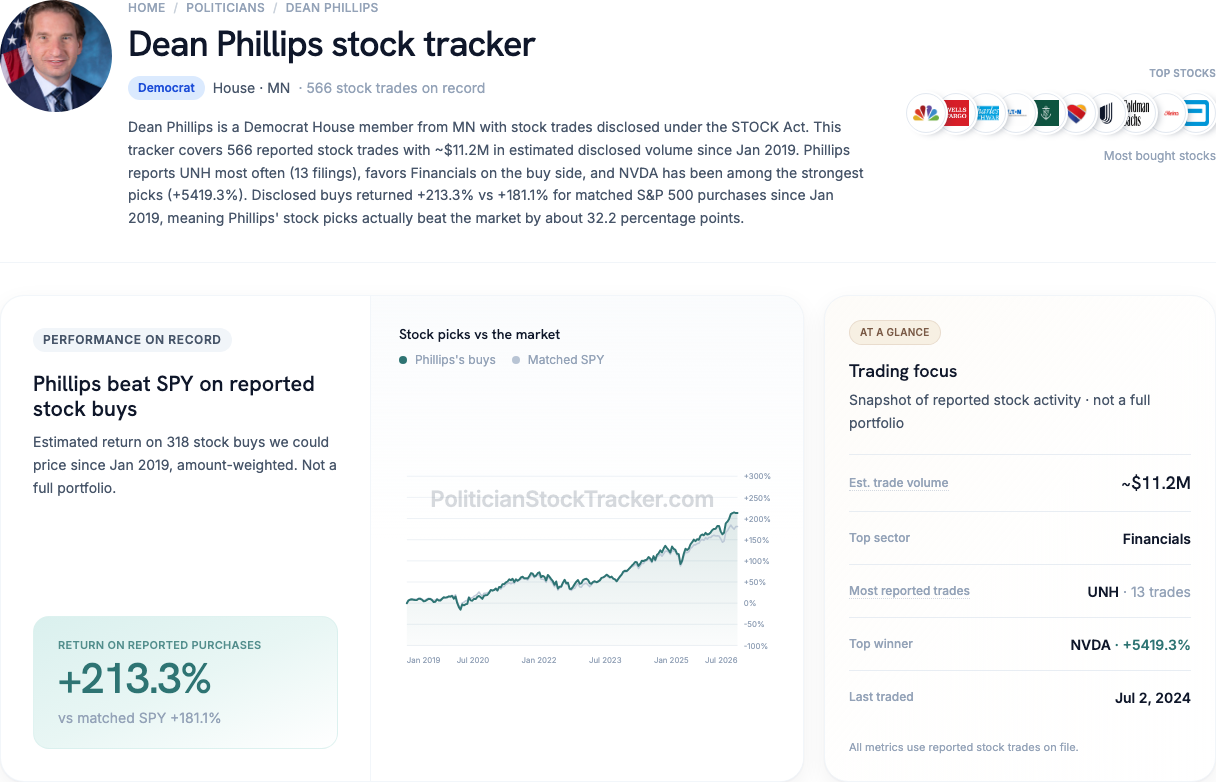
Dean Phillips insider trading claims often follow his national profile from the 2024 Democratic primary. We do not claim he broke the law. Public STOCK Act data shows a quieter picture: disclosed buys beat the S&P 500 modestly—while trade timing sits near a coin flip.
The short answer
| Question | What our data shows |
|---|---|
| Did his reported buys beat the market? | Yes, modestly. About 213% vs about 181% for the S&P 500 on the same dates |
| Did he pick unusually good days to trade? | Not really. About 49% overall (50% is pure luck) |
So filings look more like solid stock selection over time—not a clear calendar edge.
Did his buys beat the market?
Here's how we measure it. We take the stock purchases Phillips disclosed, estimate how those buys did, and compare that to buying the S&P 500 (via SPY, a fund that tracks the index) with the same money on the same days.
On 318 purchases we could price since January 2019, Phillips's disclosed buys returned about 213%. The matched S&P 500 path returned about 181%. He came out ahead—clearly, but not in “blowout” territory.
Stocks he discloses often include CMCSA, WFC, SCHW, ETN, NTRS, and LUV—a mix of media, banks, industrials, and airlines rather than a pure mega-cap tech basket.
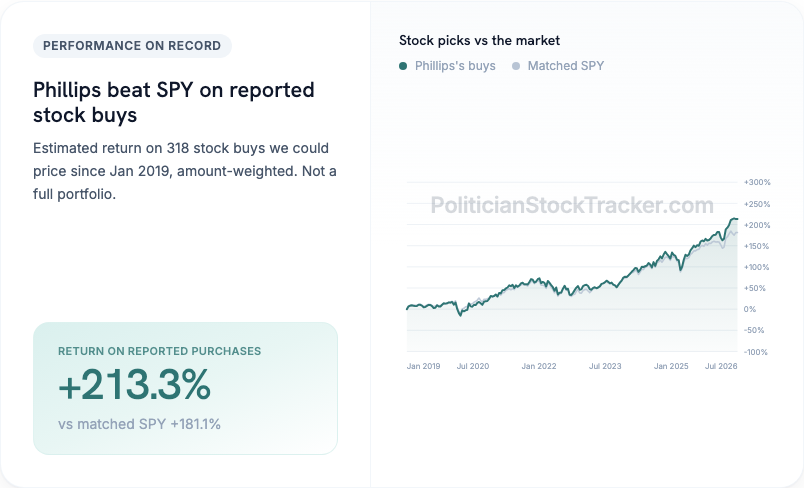
One caveat: this is only disclosed stock purchases—not his full net worth, and not every sale.
Did he time the market?
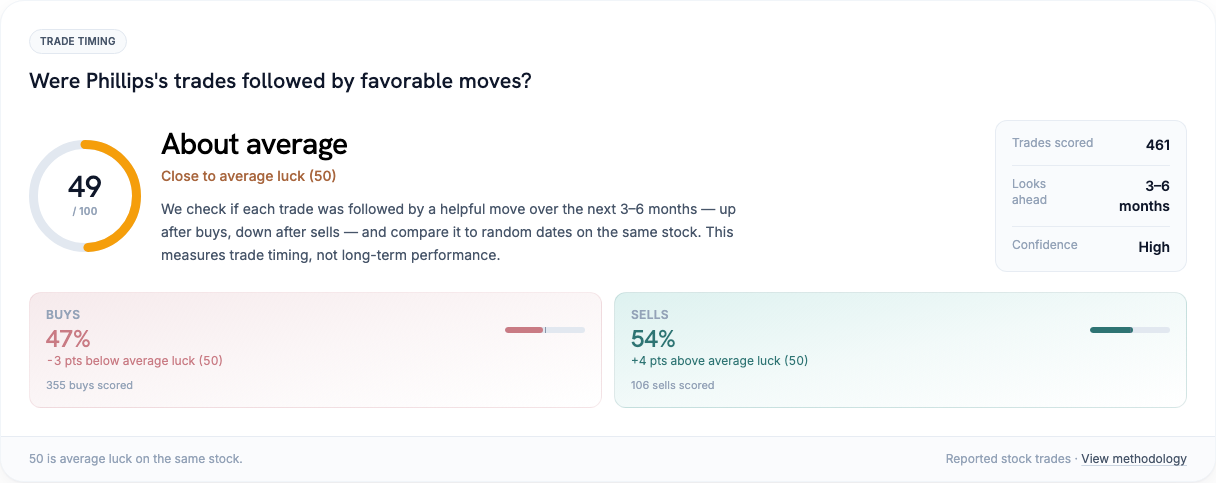
"Timing" asks: when Phillips bought or sold a stock, was that a better day than a random day for that same stock?
Think of 50% as a coin flip.
| Measure | Score | vs 50% luck |
|---|---|---|
| Overall | 49% | −1 point |
| Buys | 47% | −3 points |
| Sells | 54% | +4 points |
- We scored 461 trades across 195 stocks (high confidence).
49% overall is effectively random. Slight sell-side strength does not change the headline: there is no strong timing edge in this sample.
Putting both together
- Market returns on buys: ahead of the S&P 500.
- Trade timing: near a coin flip.
That is a milder version of the Pelosi / Wyden pattern: returns look better than timing. Neither number proves or disproves insider trading.
Track this on Politician Stock Tracker
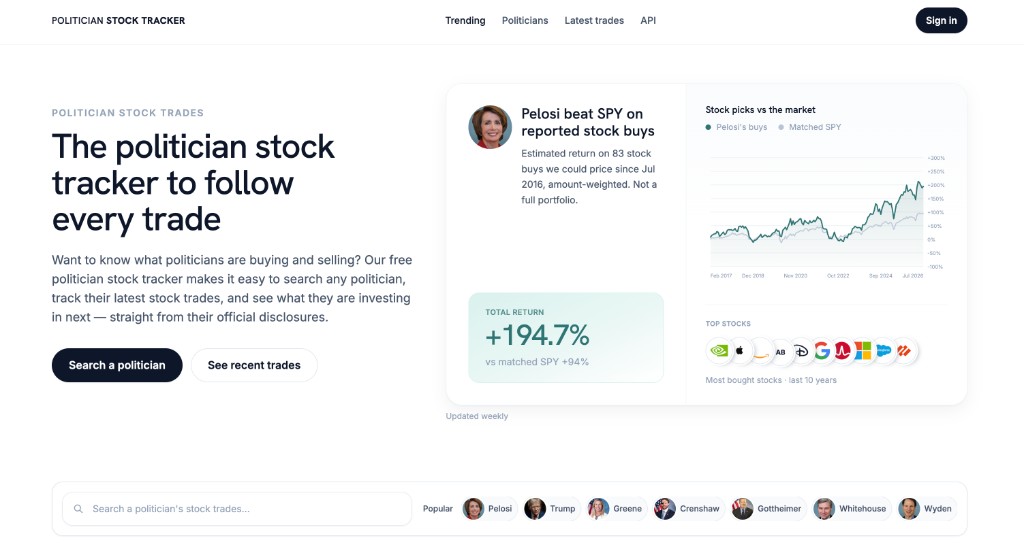
See Phillips's live numbers on Politician Stock Tracker at his Dean Phillips stock tracker page.
Disclaimer
Data compiled from public STOCK Act financial disclosure filings. Return and timing figures use disclosed purchase ranges and statistical models; they are not audited portfolio statements or legal findings. This article does not allege insider trading. Not legal or investment advice.