Blog
Did Nancy Pelosi Beat the Stock Market?
Politician Stock Tracker
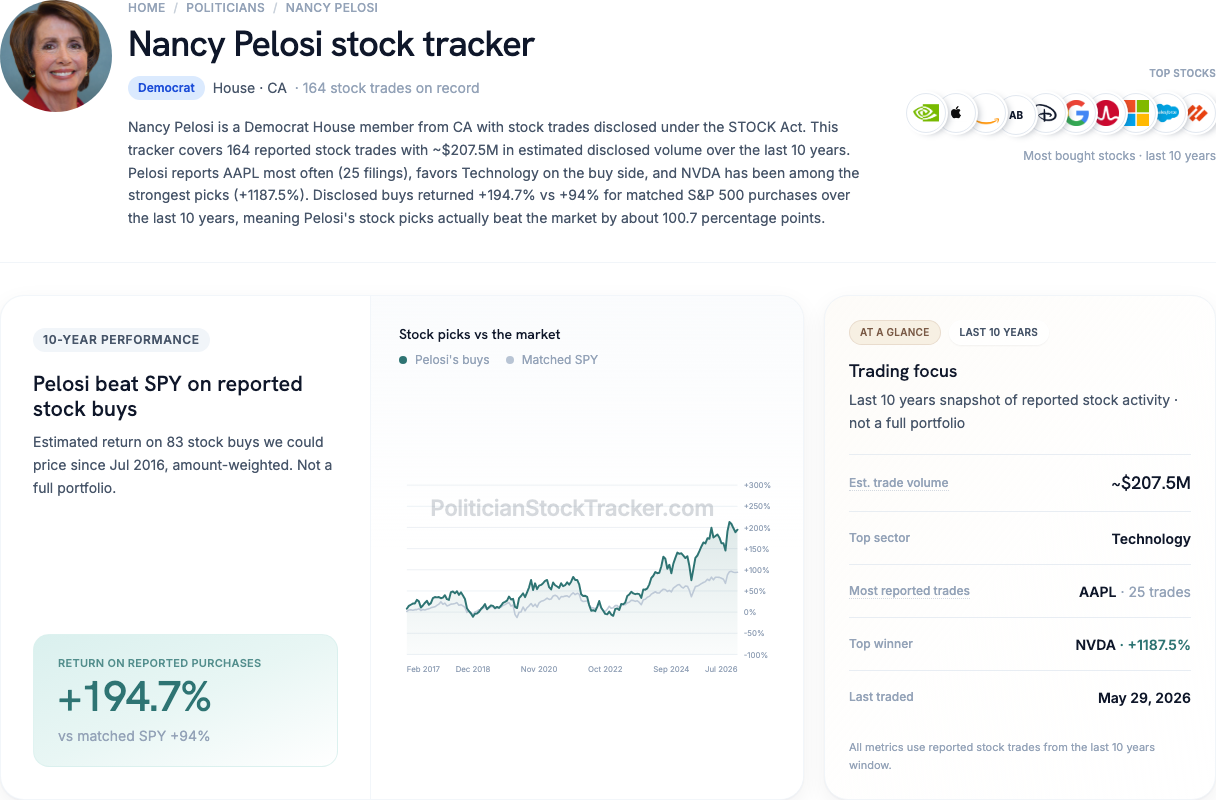
Did Nancy Pelosi beat the stock market? On the stock purchases she has disclosed since mid-2016, our answer is yes—at least in this window. Those buys returned about 195%. Buying the S&P 500 with the same money on the same days returned about 94% (about 1.5× the benchmark). That is a narrow lens on STOCK Act disclosures—not her entire wealth.
The short answer
| Question | What our data shows |
|---|---|
| Did disclosed buys beat the S&P 500? | Yes — about 195% vs 94% |
| How many buys? | 83 purchases we could price since mid-2016 |
| Did she pick great days to trade? | Mixed/above chance — about 53% vs a 50% luck baseline |
Beating the market on what she bought and beating it on when she traded are different questions.
How we compare her to the market
Imagine this: every time Pelosi disclosed a stock purchase, you bought the same amount of the S&P 500 (through SPY, a fund that tracks the index) on that same day. Then you compare the two paths.
- Pelosi's disclosed buys: about 195%
- S&P 500 on the same dates: about 94%
Her most-disclosed names include AAPL, NVDA, AMZN, AB, DIS. This is a long window covering the 2010s–2020s bull run in mega-cap tech.
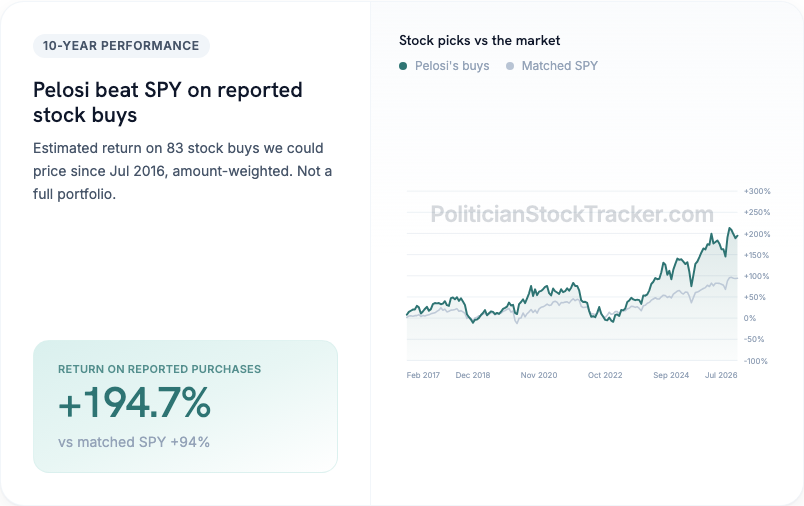
Limits to keep in mind: disclosure forms report dollar ranges, not exact share counts. This measure covers disclosed stock purchases only—not every asset class. Full details live on her Nancy Pelosi stock tracker page.
Timing is a separate question
Some people hear "beat the market" and mean "she knew the perfect day to buy." That is trade timing—and we measure it separately.
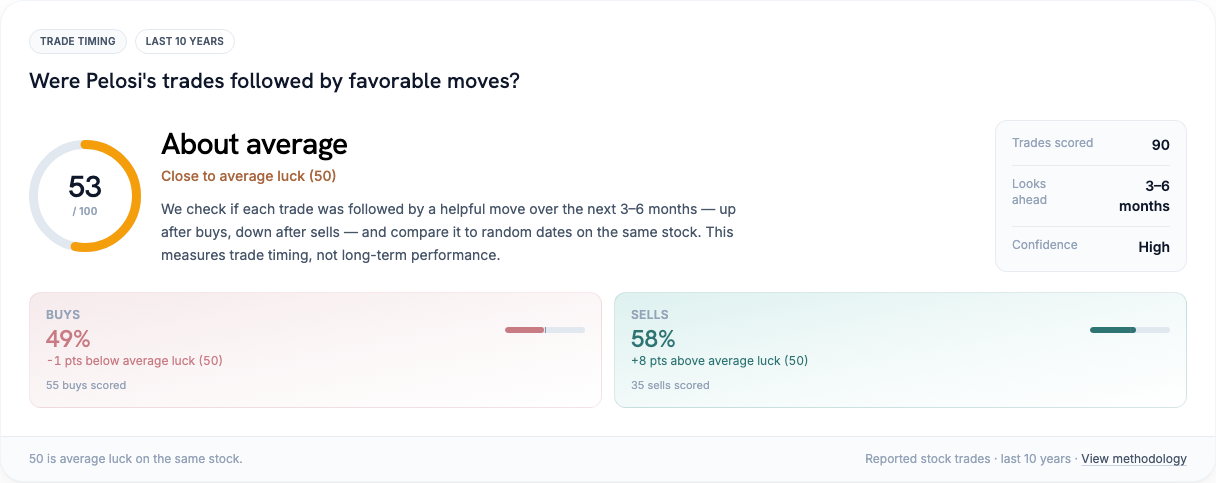
50% is roughly what random luck looks like. Pelosi's overall score sits around 53%:
| Measure | Score | vs 50% luck |
|---|---|---|
| Overall | 53% | +3 points |
| Buys | 49% | -1 points |
| Sells | 58% | +8 points |
With high confidence and 90 scored trades across 24 stocks, treat this as directional, not definitive.
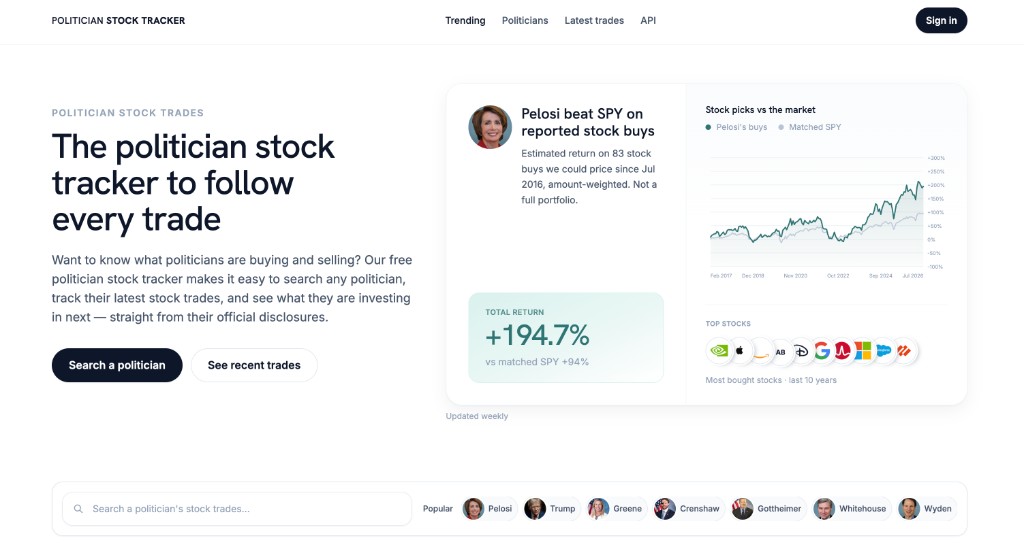
Track this on Politician Stock Tracker
Follow Pelosi's numbers on Politician Stock Tracker at her Nancy Pelosi stock tracker page—or browse politicians beating the market for wider comparisons.
Disclaimer
Data compiled from public STOCK Act financial disclosure filings. Return and timing figures use disclosed purchase ranges and statistical models; they are not audited portfolio statements. Not investment advice.