Blog
Did Nancy Pelosi Have Insider Information? What Her Stock Trades Show
Politician Stock Tracker
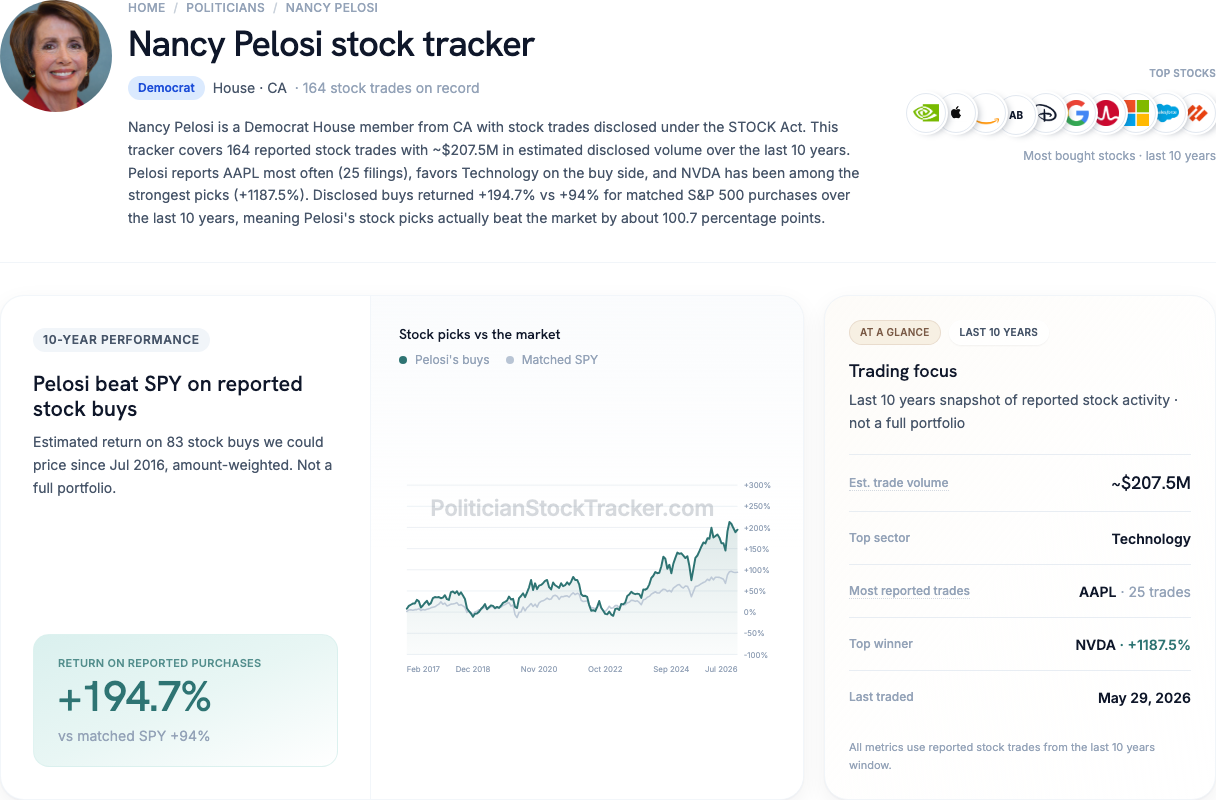
Did Nancy Pelosi have insider information? A lot of people search that because her stock filings look unusually strong. Public STOCK Act data does show impressive results on the stocks she reported buying. That is not the same as proving she always picked the perfect day to trade. We do not claim she broke the law. We separate two simple questions: what she owned, and when she traded.
The short answer
Pelosi looks like a strong long-run stock picker on disclosed purchases—and roughly average on trade timing:
| Question | What our data shows |
|---|---|
| Did her reported buys beat the market? | Yes. About 195% vs about 94% for the S&P 500 on the same dates (1.5×) |
| Did she pick unusually good days to trade? | Not really. About 53% overall (50% is pure luck) |
So the story in the filings is closer to owning the right stocks for a long time—not a clear “market timing” superpower.
Did her buys beat the market?
Here's how we measure it. We take the stock purchases Pelosi disclosed, estimate how those buys did, and compare that to buying the S&P 500 (via SPY, a fund that tracks the index) with the same money on the same days.
On 83 purchases we could price since mid-2016, Pelosi's disclosed buys returned about 195%. The matched S&P 500 path returned about 94%. That is a clear win—about 1.5× the benchmark.
Her most-disclosed names include AAPL, NVDA, AMZN, AB, and DIS. Holding and adding big tech and growth stocks through the 2010s–2020s bull market explains a lot of that gap. In plain terms: which stocks, held over time—not necessarily calling every short-term swing.
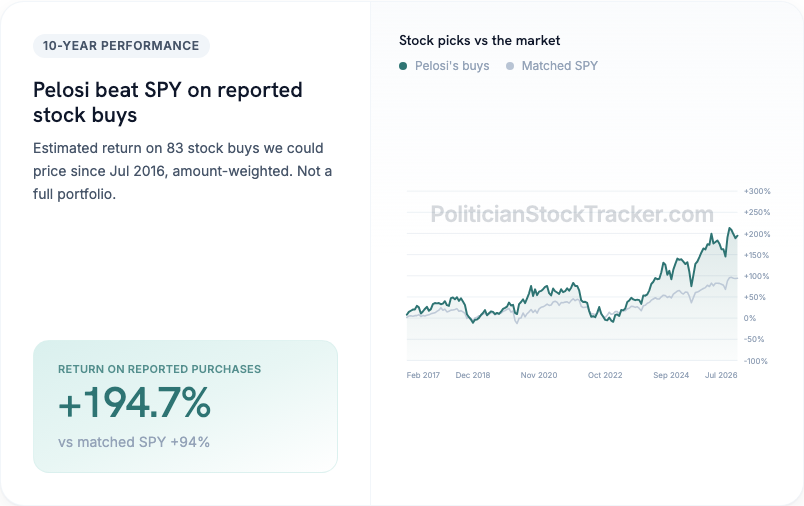
One caveat: this is only disclosed stock purchases—not her full net worth, and not every sale.
Did she time the market?
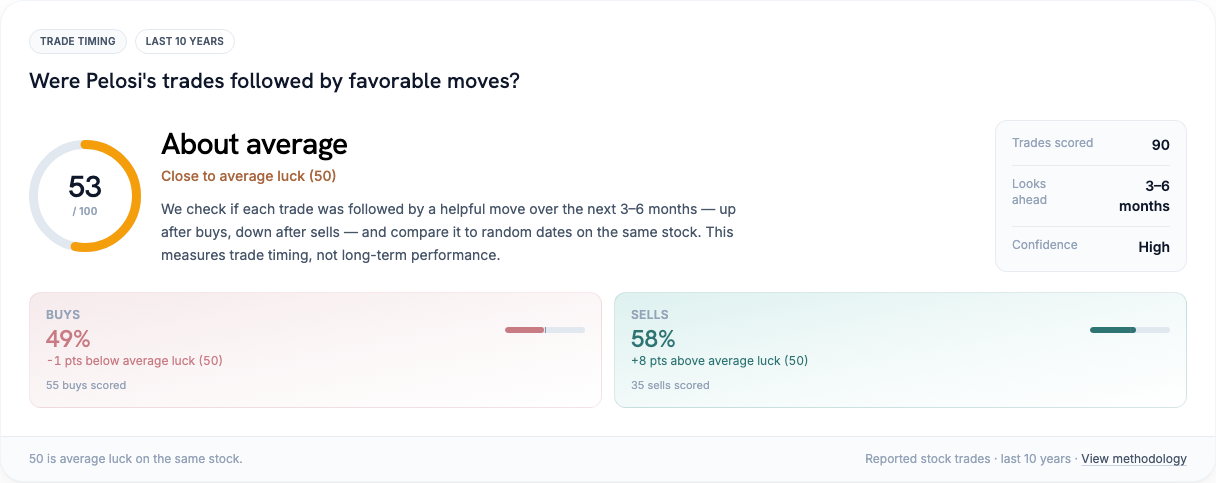
"Timing" asks a different question: when Pelosi bought or sold a stock, was that a better day than a random day for that same stock?
Think of 50% as a coin flip. Scores near 50% look like luck. Scores well above it can look like an edge—if the sample is solid.
| Measure | Score | vs 50% luck |
|---|---|---|
| Overall | 53% | +3 points |
| Buys | 49% | −1 point |
| Sells | 58% | +8 points |
- We scored 90 trades across 24 stocks (high confidence).
- 6 recent trades still need more time before we can score them fully.
53% overall is only a little above chance. Buy timing at 49% does not look like someone who systematically bought right before big jumps. Sell timing at 58% is somewhat better—but not the kind of gap you would expect from someone who always “knows the news” first.
Putting both together
- Market returns on buys: clearly ahead of the S&P 500.
- Trade timing: near a coin flip overall.
A politician can look like a great investor because they owned the right stocks for years, while still showing no strong edge on individual trade dates. Pelosi's filings fit that pattern: strong long-run bets, unremarkable timing.
That combination does not prove insider information—and 53% timing does not disprove it either. It simply shows where the public data points.
What filings still leave out
- Motives, private briefings, or non-public documents.
- Whether trades were filed on time (see late disclosures).
- Exact share counts—usually only dollar ranges, weeks or months later.
Track this on Politician Stock Tracker
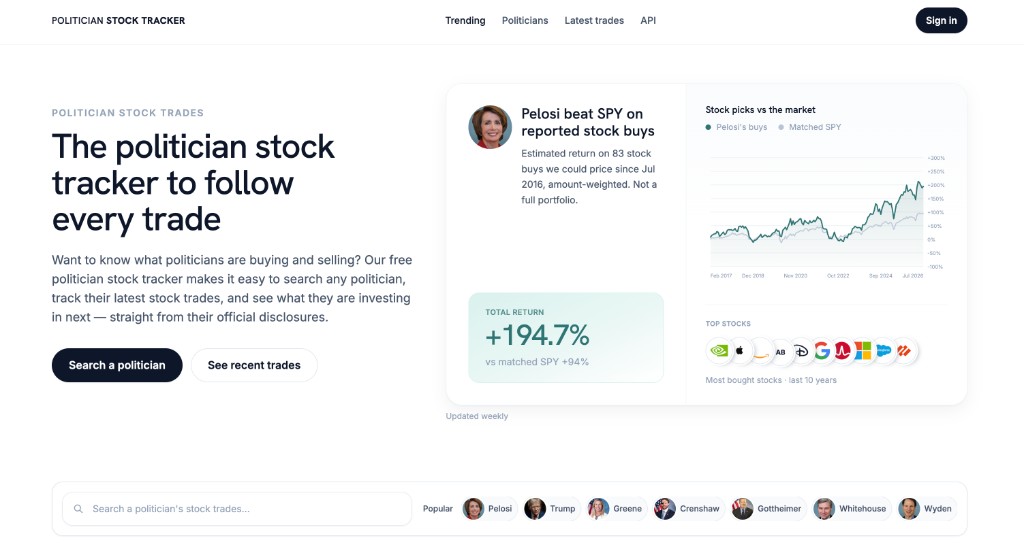
See Pelosi's live numbers on Politician Stock Tracker at her Nancy Pelosi stock tracker page.
Disclaimer
Data compiled from public STOCK Act financial disclosure filings. Return and timing figures use disclosed purchase ranges and statistical models; they are not audited portfolio statements or legal findings. This article does not allege insider trading. Not legal or investment advice.