Blog
Do Politicians Beat the Stock Market?
Politician Stock Tracker
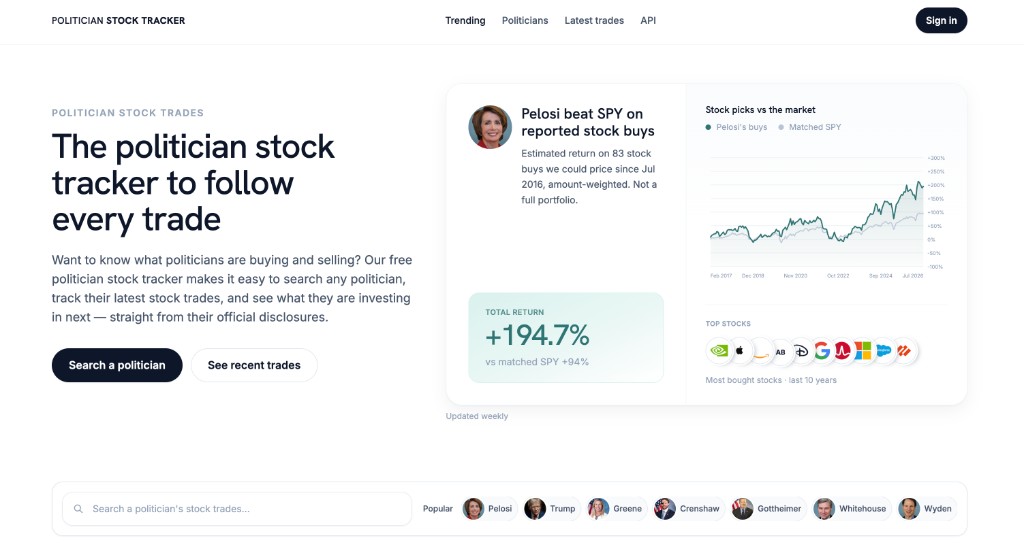
Some members of Congress are famous for stock trading headlines—but do politicians beat the stock market as a group? The honest answer from public disclosure data is not everyone, but a meaningful share does when you measure disclosed stock purchases against matched S&P 500 buys on the same dates.
The short answer
Using our latest rankings on disclosed stock purchases over the last 10 years (minimum five priced buys per member):
- 33 of the top 50 ranked members beat matched S&P 500 purchases on the same trade dates and amounts (
beatSpyMultiplierabove 1.0). - 17 of those 50 did not beat the matched benchmark over the same window.
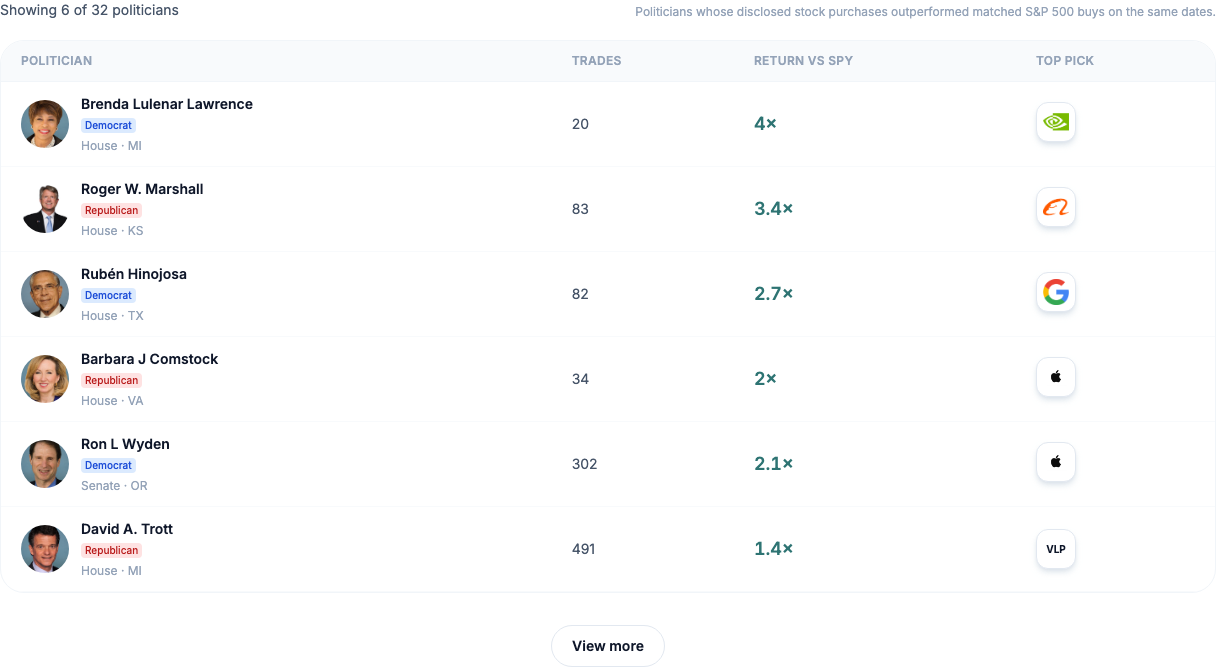
- 32 members currently appear on our politicians beating the market list, which filters to outperformers only.
So politicians do not universally beat the market—but a substantial minority of active traders with enough disclosed data has outperformed a matched SPY baseline, not a generic buy-and-hold line.
Who leads right now?
Among members with the strongest edge vs matched S&P 500 buys in our data:
| Politician | Chamber | Disclosed return (10y window) | vs matched SPY |
|---|---|---|---|
| Brenda Lawrence | House | +1,187% | 4.0× benchmark |
| Roger Marshall | House | +977% | 3.4× benchmark |
| Rubén Hinojosa | House | +946% | 2.7× benchmark |
| Barbara Comstock | House | +537% | 2.0× benchmark |
| Ron Wyden | Senate | +468% | 2.2× benchmark |
These figures reflect reported stock purchases only, weighted by disclosed amount ranges—not a full net-worth portfolio or every asset class.
What this does—and does not—measure
What we include
- House PTR and Senate periodic transaction reports, plus executive-branch OGE filings where applicable.
- Returns on disclosed common-stock buys we can price, compared with matched S&P 500 purchases on the same dates.
What we exclude
- Trades filed late (see our late disclosures tracker).
- Assets reported only in broad value buckets without tickers.
- Exact share counts—filings use ranges (e.g. $15,001–$50,000), so returns are estimates.
That is why “beat the market” here means beat matched SPY on disclosed buys, not “every politician is a hedge-fund genius.”
A different question: timing the market
“Beating the market” can also mean picking unusually good days to trade—not how much purchases grew. That is a separate metric on Politician Stock Tracker.
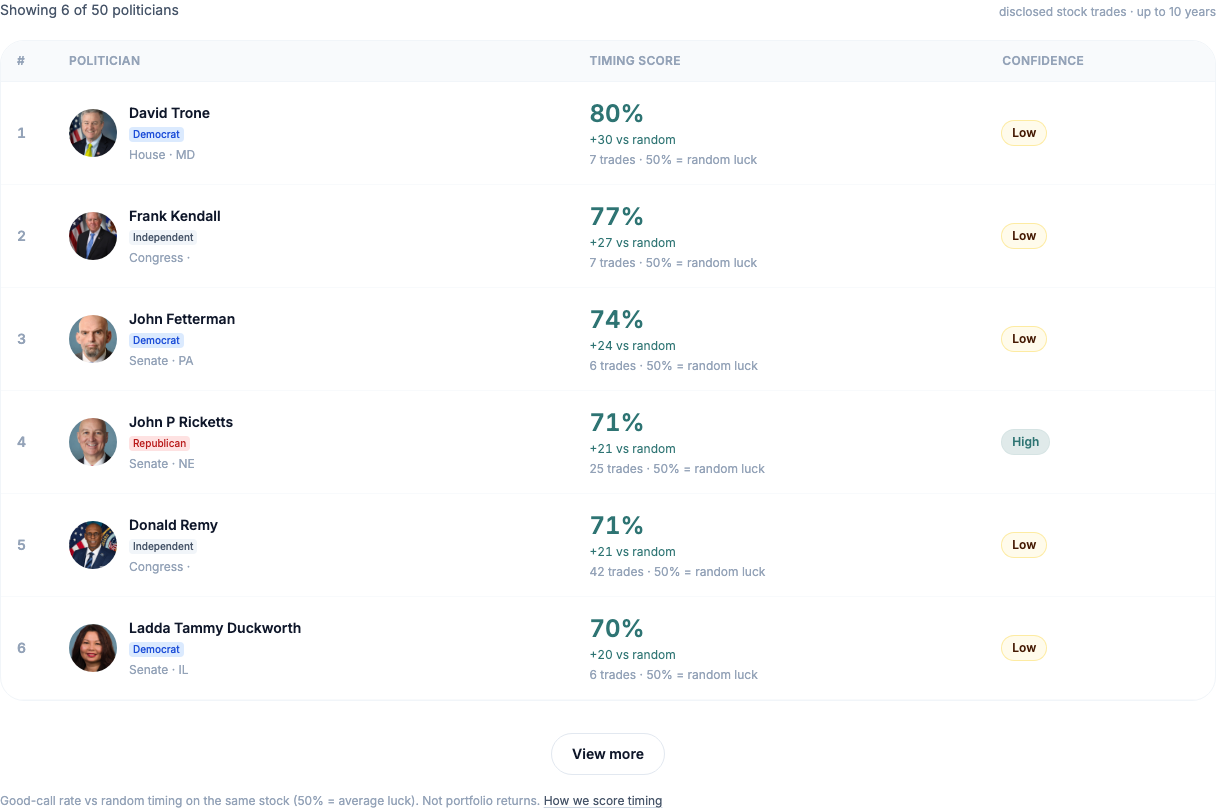
Our do politicians time the market? ranking scores disclosed buys and sells against random dates on the same stock. The baseline is 50% — what you would expect from luck. Scores above 50% mean trades tended to land on better-than-random days (buys before rises, sells before falls), relative to comparable random timing.
247 members currently have enough scored trades for that list. Recent leaders include David Trone (80% timing score, 7 trades analysed) and John P Ricketts (71%, high confidence on 25 trades)—different names than the return leaderboard above. A politician can show strong returns without top timing, or the reverse.
Good timing does not prove insider knowledge; it is a statistical pattern in public filings only.
Track this on Politician Stock Tracker
For daily-updated rankings, filters, and politician-level breakdowns, use Politician Stock Tracker. Start with the politicians beating the market page for outperformers, or browse best performing politicians for the full return leaderboard.
Disclaimer
Data compiled from public STOCK Act and OGE financial disclosure filings. Return estimates use disclosed purchase ranges and matched benchmark methodology; they are not audited portfolio statements. This article is for informational purposes only and is not investment advice.