Blog
Donald Trump Insider Trading Claims: What His Stock Trades Show
Politician Stock Tracker
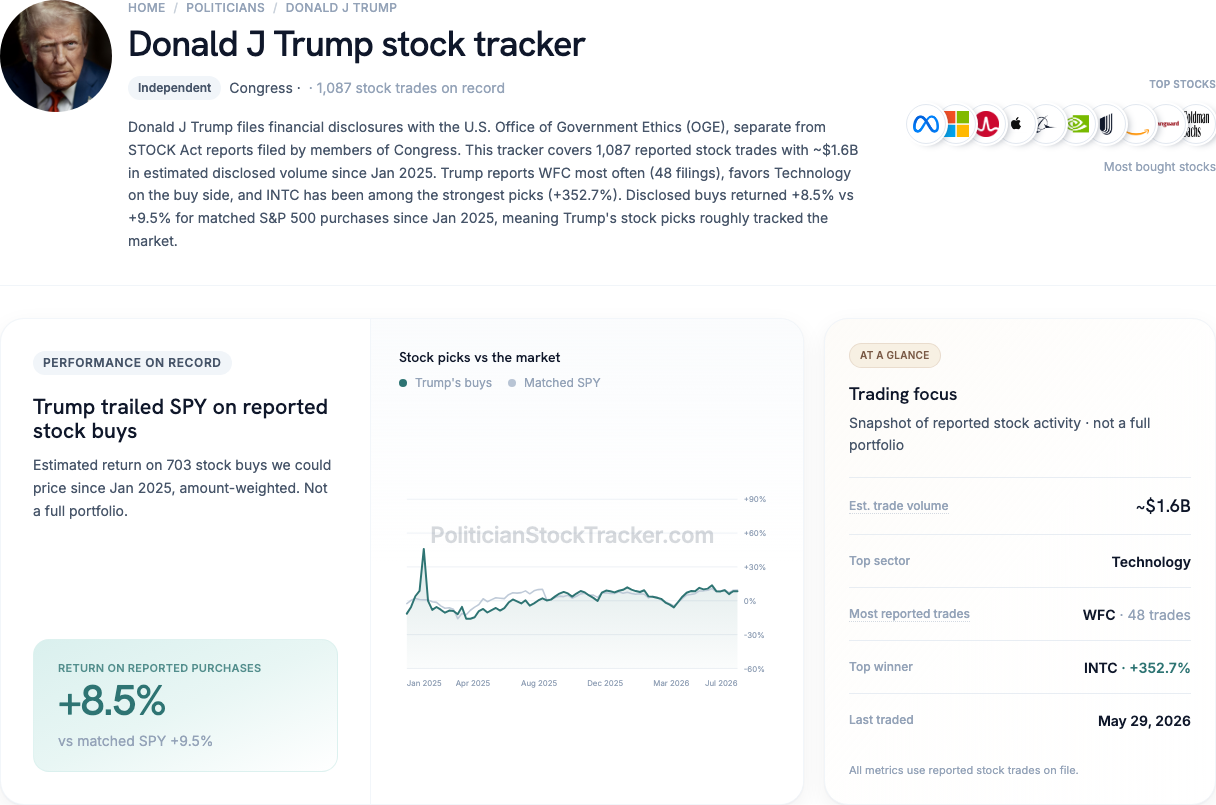
Donald Trump insider trading claims get louder whenever his name is in the news—and his stock filings keep coming. As president, he reports trades through executive-branch disclosure forms (OGE filings), not the House/Senate forms members of Congress use. Same idea: the public gets a delayed look at buys and sells. We do not claim he broke the law. We just look at what those filings show.
The short answer
Two questions matter, and they are not the same:
| Question | What our data shows |
|---|---|
| Did his reported buys beat the market? | No. About 8.5% vs about 9.5% for the S&P 500 on the same dates |
| Did he pick unusually good days to trade? | Mixed. Overall about 55% (50% is pure luck). Buys look weak; sells look better |
So: his disclosed purchases have not clearly beaten the market in our recent window. His sell dates look a bit luckier than random—but we would not hang a big claim on that. None of this proves (or disproves) insider information. It just shows what public filings look like.
Did his buys beat the market?
Here's how we measure it. We take the stock purchases Trump disclosed, estimate how those buys did, and compare that to buying the S&P 500 (via SPY, a fund that tracks the index) with the same money on the same days.
Since January 2025, on 703 purchases we could price, Trump's disclosed buys returned about 8.5%. The matched S&P 500 path returned about 9.5%. He came in slightly behind—not a blowout either way.
The stocks he discloses most often include META, MSFT, AVGO, AAPL, BA, and NVDA—mostly big tech and industrials. Some recent filings also show very large purchase ranges (multi-million dollars), far above his more typical $15,001–$50,000 buckets. Big trades make headlines; they do not automatically mean better results. See our largest stock trades page for examples.
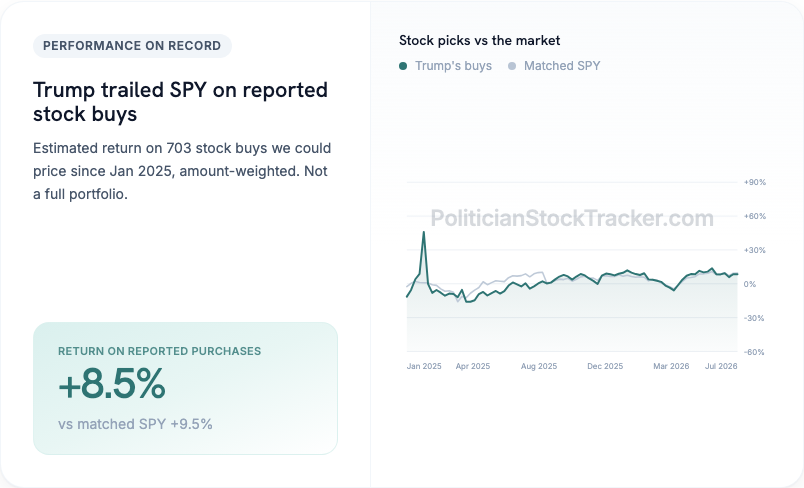
One caveat: this is only disclosed stock purchases since early 2025. It is not his full net worth, and it is not every sale.
Did he time the market?
"Timing" asks a different question: when Trump bought or sold a stock, was that a better day than a random day for that same stock?
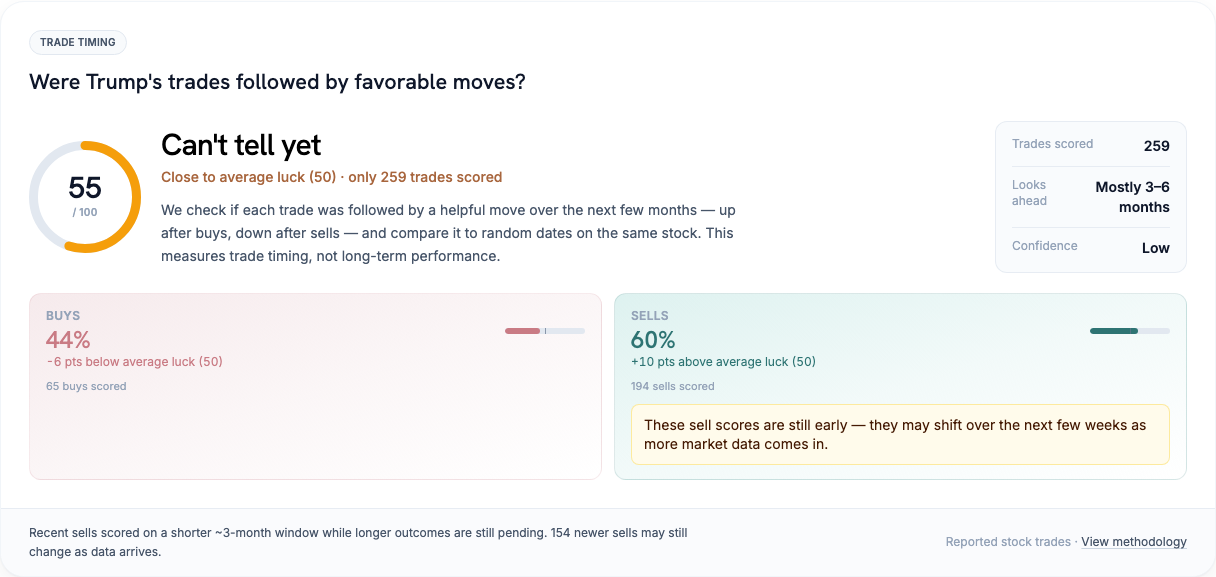
Think of 50% as a coin flip. Scores near 50% look like luck. Scores well above it look like an edge—if the sample is solid.
| Measure | Score | vs 50% luck |
|---|---|---|
| Overall | 55% | +5 points |
| Buys | 44% | −6 points |
| Sells | 60% | +10 points |
- We scored 259 trades across 19 stocks.
- Confidence is low—the sample is thin relative to how noisy markets are.
- Trump discloses a lot: about 1,087 transactions show up in our coverage.
Buy timing at 44% is below a coin flip. Sell timing at 60% pulls the overall number up. Headlines about presidents and stocks often imply he "knows when to buy." These numbers do not support that story.
Putting both together
- Market returns on buys: slightly behind the S&P 500 in our Jan 2025+ window.
- Trade timing: mixed—weak on buys, better on sells, with low confidence.
Compare that to someone like Nancy Pelosi: her disclosed buys have looked strong over long periods, while her timing scores sit near average. Trump's recent picture is almost the reverse on returns: weaker buys, somewhat better sell timing. Either way, filings alone cannot prove wrongdoing.
Volume, late filings, and what we cannot see
Trump is one of the busiest disclosers we track. He also shows up on our late disclosures list—25 late entries in the current sample, with one gap around 493 days. Late filing means the public learns about trades long after they happened. That makes "copy trading" or real-time conflict checks much harder.
Filings also leave a lot out: motives, private meetings, and exact share counts. We usually only get dollar ranges, weeks or months later.
Track this on Politician Stock Tracker
See Trump's live numbers on Politician Stock Tracker at his Donald Trump stock tracker page.
Disclaimer
Data compiled from public OGE and STOCK Act financial disclosure filings. Return and timing figures use disclosed purchase ranges and statistical models; they are not audited portfolio statements or legal findings. This article does not allege insider trading. Not legal or investment advice.