Blog
Tommy Tuberville Insider Trading Claims: What His Stock Trades Show
Politician Stock Tracker
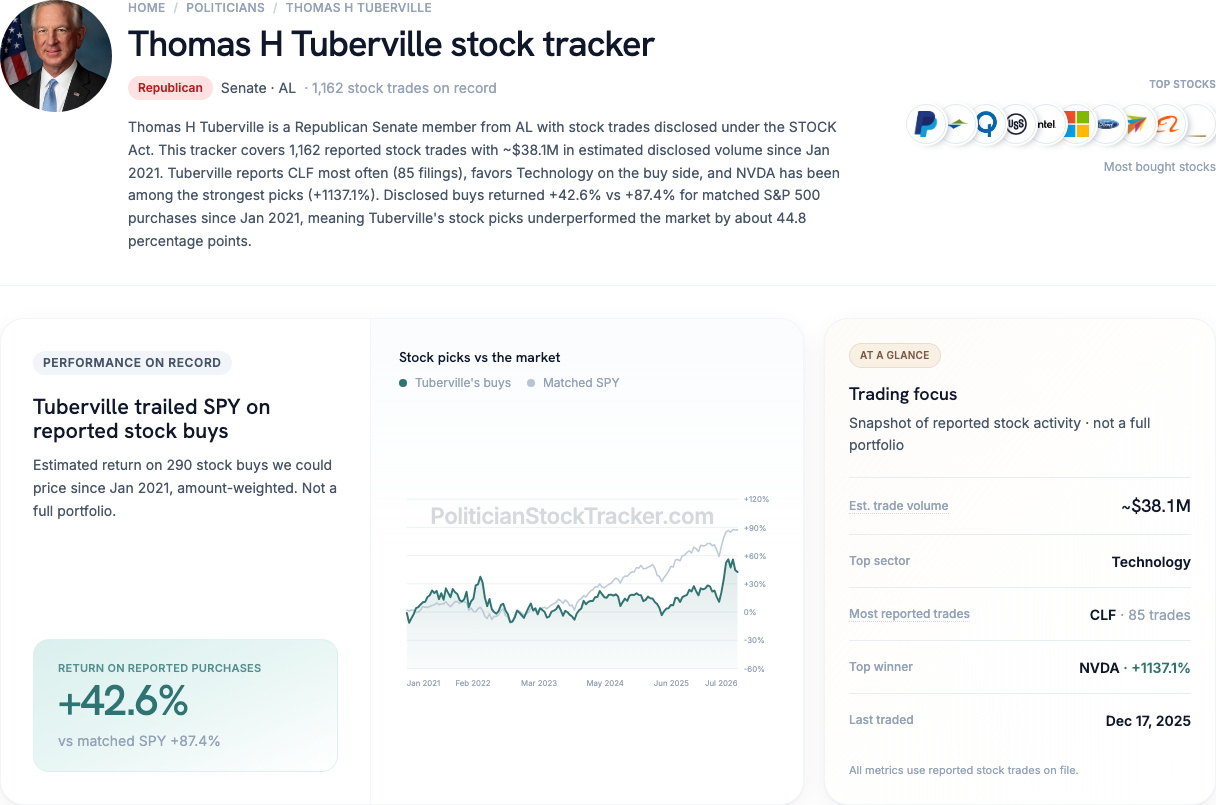
Tommy Tuberville insider trading searches spike because he is among the most active stock traders in Congress—over 1,000 disclosed equity trades in our database. We do not claim he broke the law. The public record shows a gap many readers miss: high activity does not equal strong returns—and his timing scores sit near random.
The short answer
| Question | What our data shows |
|---|---|
| Did his reported buys beat the market? | No. About 43% vs about 87% for the S&P 500 on the same dates |
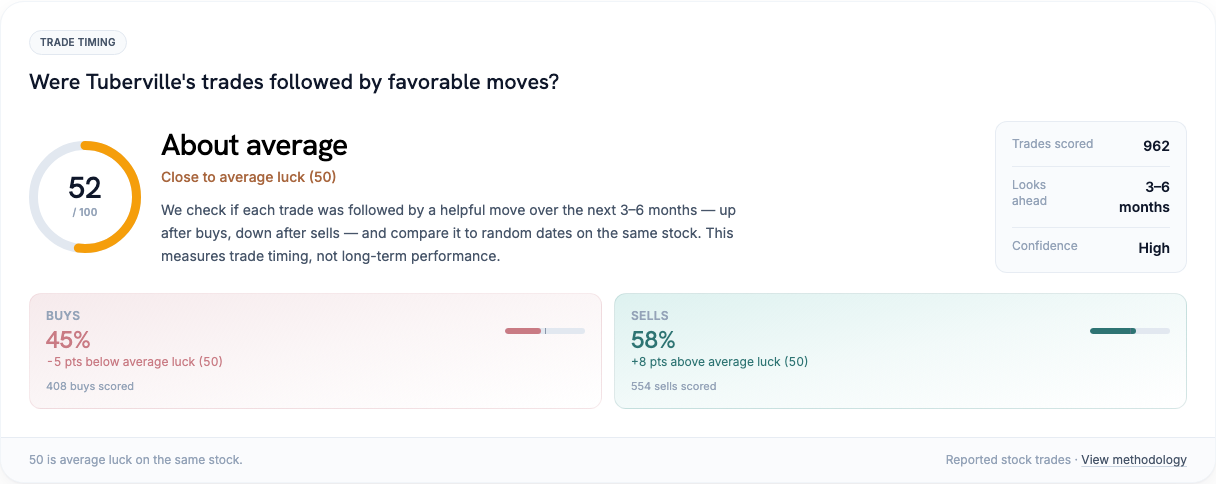
| Did he pick unusually good days to trade? | Not really. About 52% overall (50% is pure luck) |
Tuberville trades often, but filings do not show him as a standout investor on either returns or timing.
Did his buys beat the market?
Here's how we measure it. We take the stock purchases Tuberville disclosed, estimate how those buys did, and compare that to buying the S&P 500 (via SPY, a fund that tracks the index) with the same money on the same days.
On 290 purchases we could price since January 2021, Tuberville's disclosed buys returned about 43%. The matched S&P 500 path returned about 87%.
That is roughly half the benchmark—not the profile of someone whose reported buys consistently beat the market. Heavily traded names include CLF (Cleveland-Cliffs), PYPL, X (U.S. Steel), QCOM, and INTC—industrial and tech names with mixed cycles over the period.
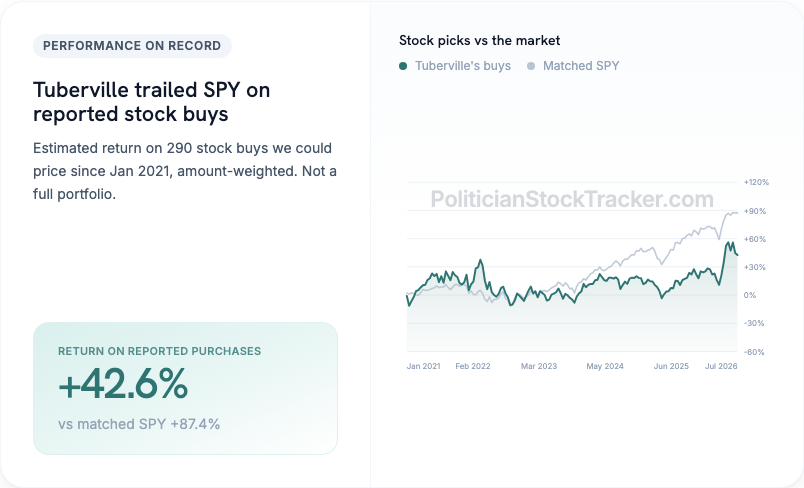
If you equate trading volume with skill, note this: Tuberville ranks near the top of our most active congress stock traders list, yet trailed the S&P 500 on priced buys in this window.
Did he time the market?
"Timing" asks: when Tuberville bought or sold a stock, was that a better day than a random day for that same stock?
Think of 50% as a coin flip.
| Measure | Score | vs 50% luck |
|---|---|---|
| Overall | 52% | +2 points |
| Buys | 45% | −5 points |
| Sells | 58% | +8 points |
- We scored 962 trades across 268 stocks (high confidence).
52% overall is essentially noise around a coin flip. Buy timing below chance and sell timing above can cancel out when both sides are active.
Putting both together
- Market returns on buys: lagged the S&P 500 badly.
- Trade timing: near a coin flip overall.
The story here is activity without a clear edge: lots of disclosed trades, weak buy returns vs the index, unremarkable timing. That undercuts the idea that filing volume alone signals investable skill—or that public data shows a hidden trading advantage.
Insider-trading claims are legal questions we cannot answer from filings alone. These numbers only describe what was disclosed.
Track this on Politician Stock Tracker
See Tuberville's live numbers on Politician Stock Tracker at his Tommy Tuberville stock tracker page.
Disclaimer
Data compiled from public STOCK Act financial disclosure filings. Return and timing figures use disclosed purchase ranges and statistical models; they are not audited portfolio statements or legal findings. This article does not allege insider trading. Not legal or investment advice.